Summary. An interesting and very successful season.
2017/18 was our most extreme season yet. Serious frosts in the weeks before budburst followed by unprecedented heat mid-season and finishing with a -5° C frost in mid-April. Not every year thanks!
One of the hottest Central Otago summers on record. The heat, early flowering and ripening and rain in February created more challenges than normal.
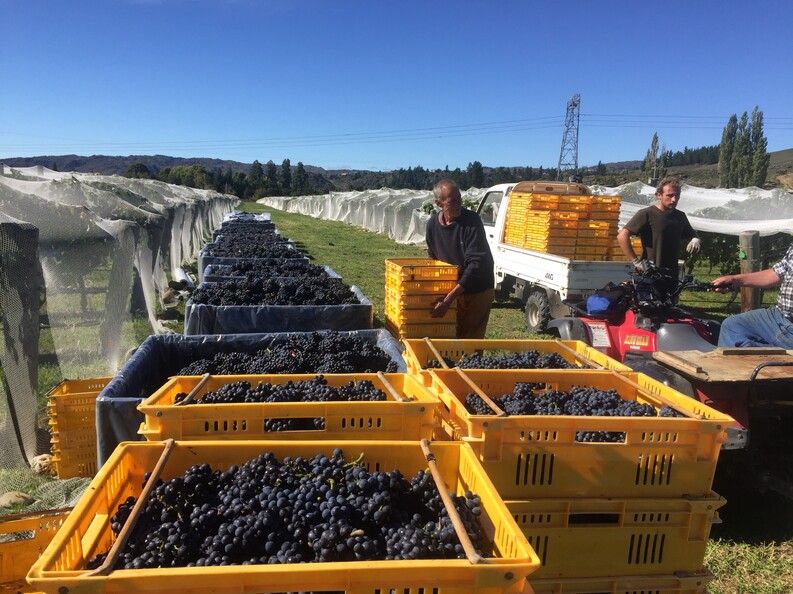
Despite the challenges the fruit was picked in excellent condition with full flavour development and above average volumes.
Temperatures in November, December and January were above average.
Growth rates in late November and December were exceptional and it was difficult to keep up with vine training and shoot thinning.
Flowering was 2-3 weeks early and the perfect conditions meant excellent fruit set resulting in large tight bunches.
Veraison was three weeks ahead of normal and grape development was set on track for our earliest harvest ever which, like clockwork, was three weeks early.
With drought conditions the under-vine growth had completely browned off by January but heavy rains from 1 February changed the vineyard from brown back to green and raised the botrytis risk as fruit sugar levels increased.
Alexandra as a sub-region benefited from some cooler late afternoon breezes which took the heat out the day and slowed ripening. This cooling and courage to delay picking as-long-as possible to develop more flavour in the fruit has, we think, paid off. Despite picking three weeks earlier than normal the fruit quality was excellent and will produce wine of excellent quality.
Monthly detail
September started with three consecutive frosts getting as low as -5 degrees. Otherwise the month was was normal to very slightly warmer than average.
October started out normal but from mid October temperatures were high for this time of year. We had six consecutive days peaking over 25 degrees (28 Oct to 2 Nov). We have not seen this level of heat, this early in spring, before. Budburst was in the first week of October but variable between blocks.
November temperatures continued above average with little rain. Temperatures averaged 3 degrees above normal. The weather patterns were predominately coming from the northwest with warmer temperatures with very little cooler southwest weather. With the heat, vine shoot growth bolted and floresence development was well advanced and hence flowering early. Flowering was complete by 30 November which is 2-3 weeks ahead of average.
December continued with temperatures well above average. The prevailing warm northwest winds and sea temperatures 2-3 degrees above normal (see chart below) were reasons for the above average temperatures. 27 December provide a surprise when overnight temperatures dropped briefly below zero degrees.
January temperatures were literally off the chart. Our historical data chart scale did not go high enough. January heat accumulation, measured as growing degree days, was over 60% higher than our average. Sea temperatures 3-5 degrees above normal. Veraison (grape colour change) came two to three weeks early.
February heavy rain on 1 February and a return to more normal temperatures helped slow ripening but humidity raised the botrytis risk.
March – similar temperatures to February. Some vineyards starting to pick by end of Feb/early March. Grasshopper Rock holds off and starts picking on 23 March. Three weeks ahead of normal and one week ahead of our previous earliest (2011).
April – Normally we would start picking in the third week of April. On 14 April a -5° to – 6° C frost finished off the canopy. The coldest mid-April frost we have experienced and a fitting end to an extreme season.
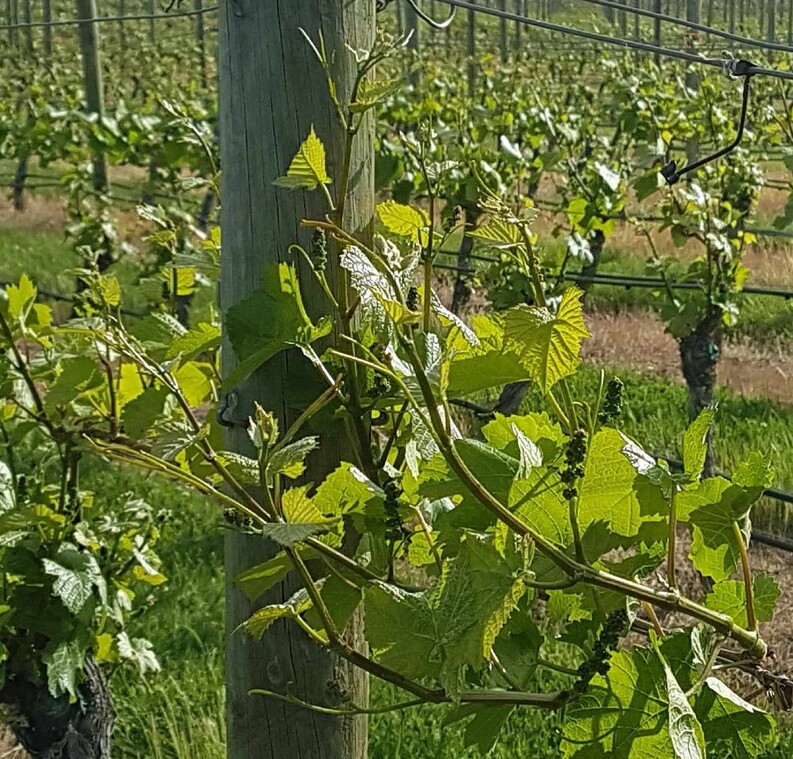
2 Nov 2017 – rapid early shoot growth
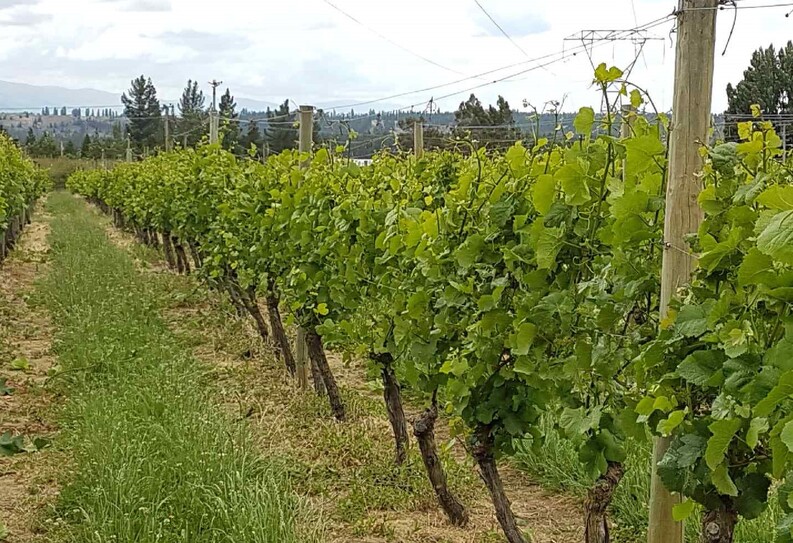
23 Nov 2017 – early flowering
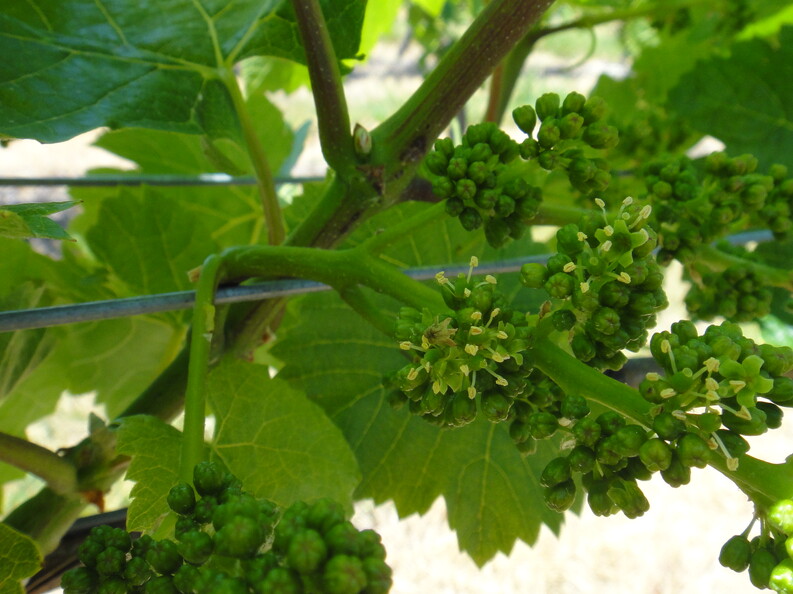
29 Nov 2017 – full flowering
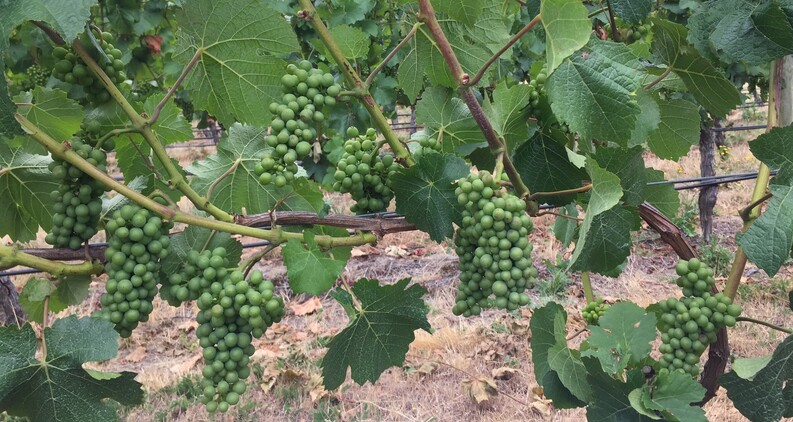
Grape development – 20 days ahead of normal
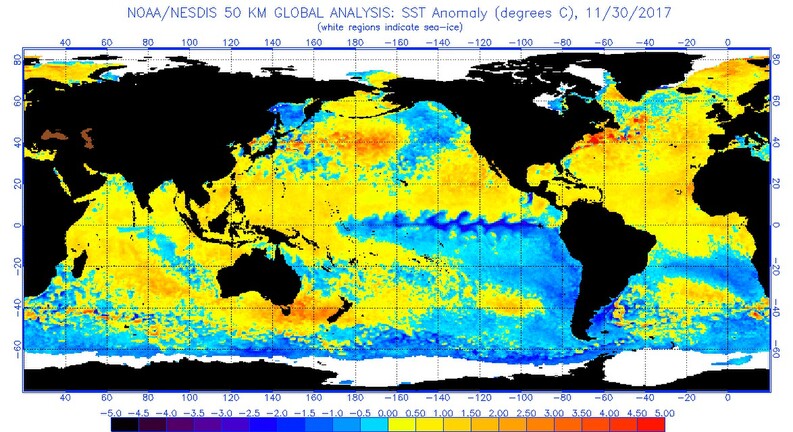
Sea surface temperature anomaly chart for 30 November shows temperatures 2-3 degrees above normal.
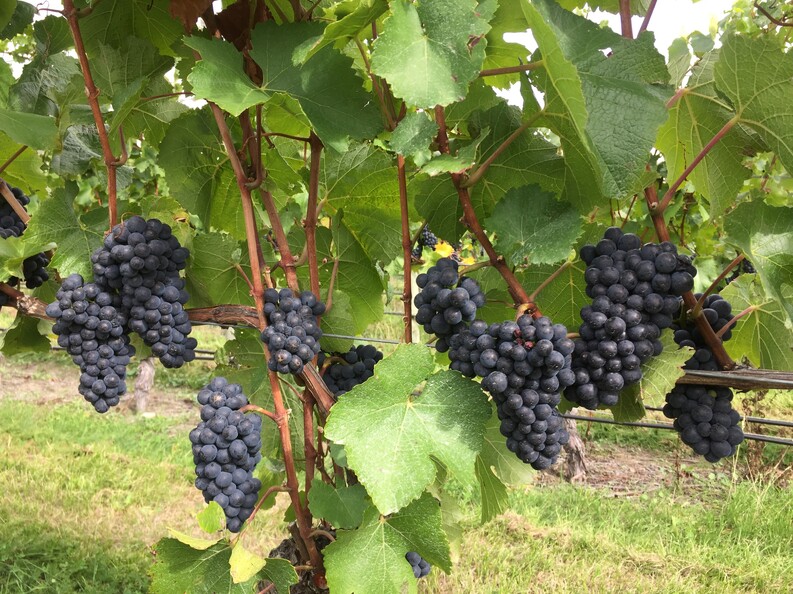
Hand harvest commenced 23 Mar 2018