Climate change – Central Otago’s story
Since we established Grasshopper Rock in 2003, I have flown many times between Auckland and Queenstown. I always sit in a window seat to make the most of the high-altitude views of this beautiful country.
The flight path is usually just west of Aoraki/Mt Cook and when the weather is clear the views are spectacular. In recent years I have been shocked to see how far and fast the Franz Josef Glacier has retreated and some years it seems every time I fly over it has retreated further.
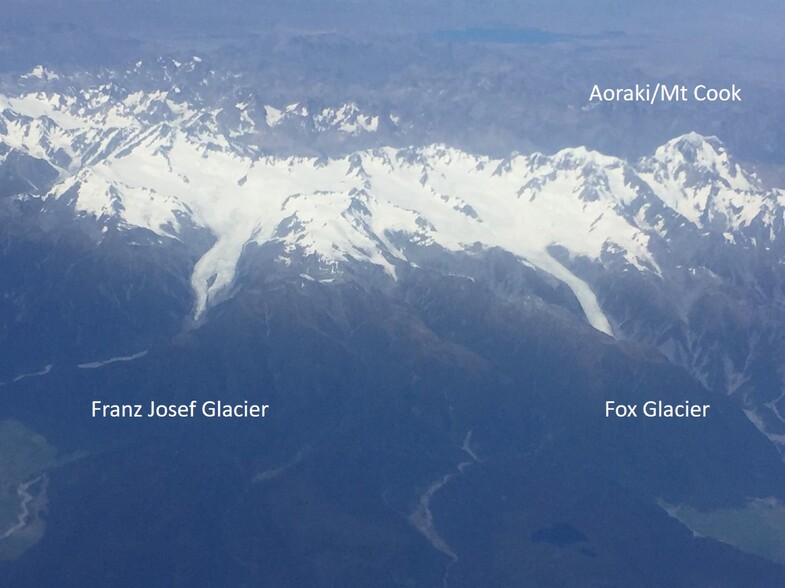
Franz Josef Glacier has been monitored closely for many years. In February 2017 Associate Professor Andrew Mackintosh from Victoria’s Antarctic Research Centre said, “Franz Josef Glacier has already retreated more than 1.5 kilometres since the end of the advance in 2008”.
At least 58 New Zealand glaciers advanced between 1983 and 2008, with Franz Josef Glacier advancing nearly continuously during this time.
“Franz Josef Glacier actually regained almost half of the total length it had lost in the twentieth century. However, Haupapa/Tasman Glacier, New Zealand’s largest glacier—which has about a third of all of New Zealand’s ice volume—continued to retreat. Because of that, New Zealand glaciers lost mass overall over this period.”
“New Zealand’s glaciers are very sensitive to temperature change. If we get the two to four degrees of warming expected by the end of the century, our glaciers are going to mostly disappear. Some may experience small-scale advance over that time due to the regional climate variability, but overall they will retreat.”
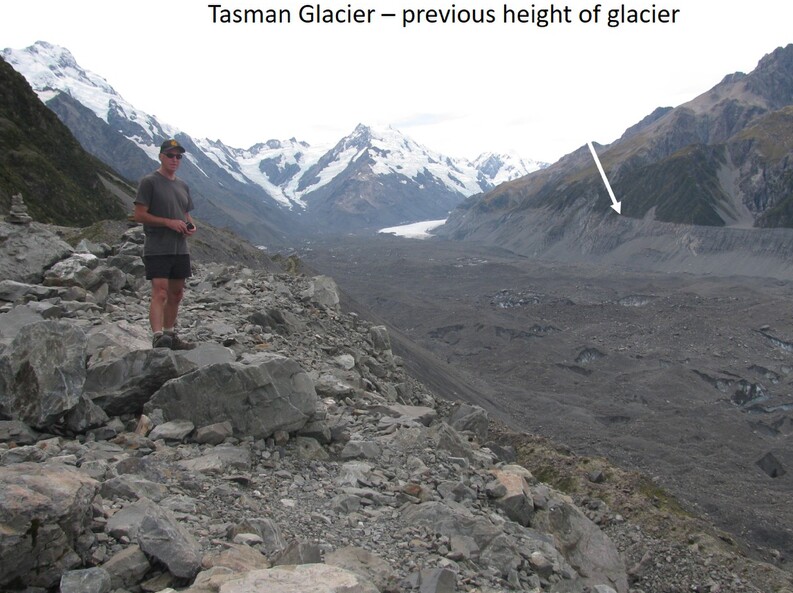
Every time I fly this route and look down on the retreating glaciers, I am reminded of climate change. The last two vintages, the very cold 2017 vintage and the extremely hot and early 2018 vintage, left us wondering what effect climate change will have on the vineyards of Central Otago. There is good climate data available to study.
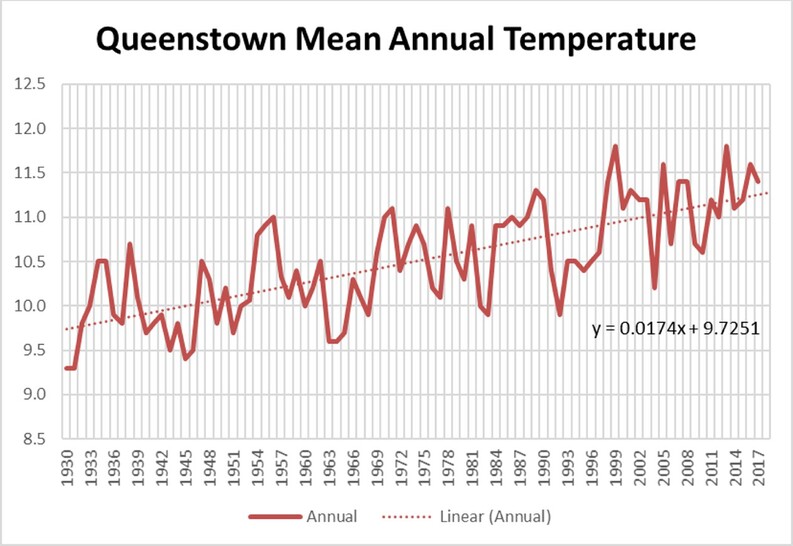
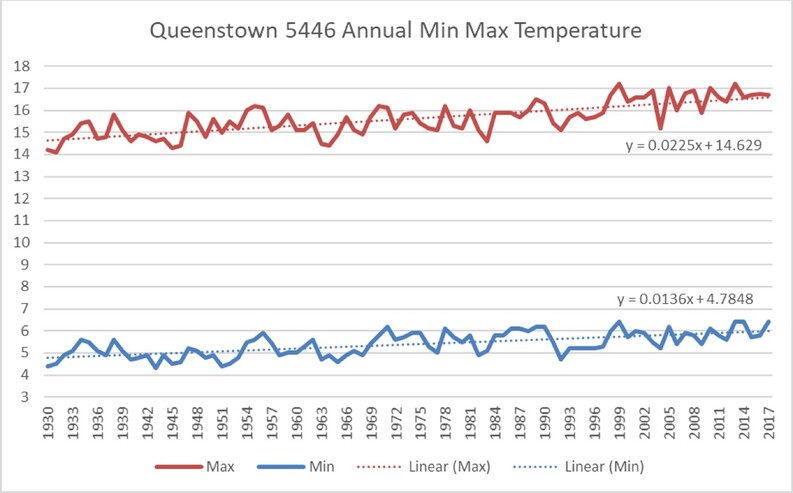
A NIWA weather station in Queenstown has data since 1871 but there are big gaps in the data until 1930. Plotting the trend line from 1930 to today shows mean temperatures have increased from about 9.7 degrees C to 11.2 degrees. In 90 years the mean temperature has trended up 1.5 degrees.
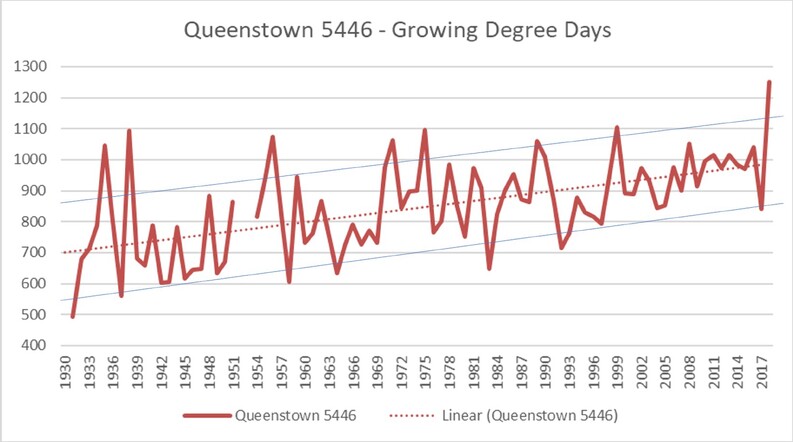
I also looked at growing degree days (GDD) which is a good measure for growing crops. GDDs measure and accumulate the mean daily temperatures above 10 degrees during the year. Pinot noir needs at least 900 GDD to be comfortable but we have ripened with less by manipulating the vine canopy and reducing crop load.
The GDD charts over time show a warming trend. Below I have plotted GDD from two weather stations (Queenstown 5446 and Alexandra 5776) for 1930 to 1983 (53 years). I chose these stations and period because they provided data from each station over a comparable period and the Alexandra station is not far from Grasshopper Rock. The GDD data applied relates to each October-April vintage period.
Queenstown and Alexandra show similar trends and good correlation of warm vintages in Alexandra and warm years in Queenstown. As expected, Alexandra is warmer than Queenstown. Queenstown is too cool (at present) for reliable grape growing. There is not perfect correlation between years, but this reflects the prevailing winds in each year. For example, some years Central Otago may experience a higher percentage of easterly weather. For example, there is more easterly weather during La Nino than during El Nino.
The trend lines show the increasing annual growing degree days.
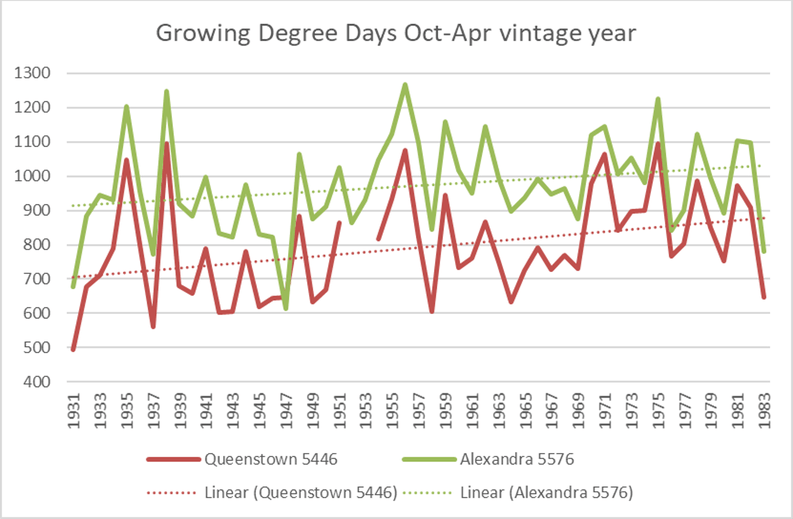
If grapes had been growing in Central Otago in 1931 it would have been a cold and most difficult vintage.
From the Queenstown chart below we can see the warm vintages in Central Otago would have been; 1935, 1938, 1956, 1970/71, 1975, 1989, 1998/9, 2018 and the cool vintages would have been; 1931, 1937, 1958, 1964, 1983, 1992, 2017. For Central Otago vignerons, 2004 and 2005 also count as cool years.
In the Queenstown 5446 chart below of mean maximum and minimum temperatures, we see the temperature increase has mainly been a function of higher maximum temperatures which have increased more than the minimum temperatures. Mean maximum has increased 2.0 degrees in 90 years whereas mean minimum has increased 1.2 degrees.
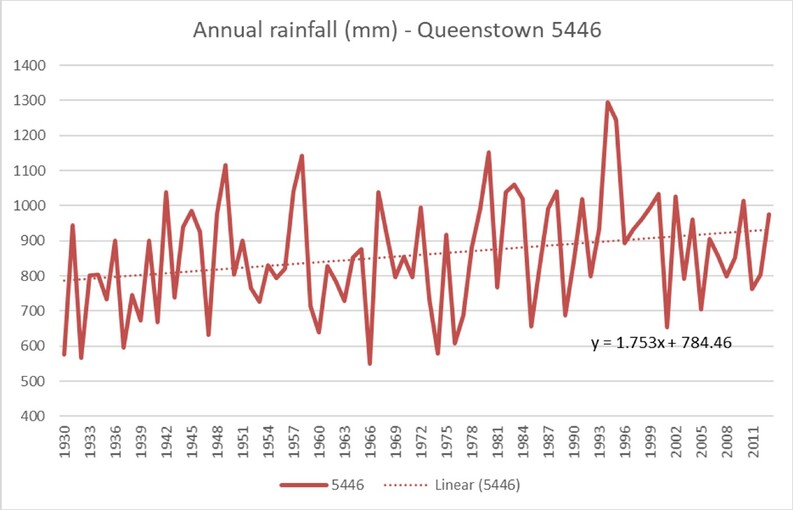
Annual rainfall is charted below. Queenstown has increased by 140 mm from 1930 to 2013 (83 years)
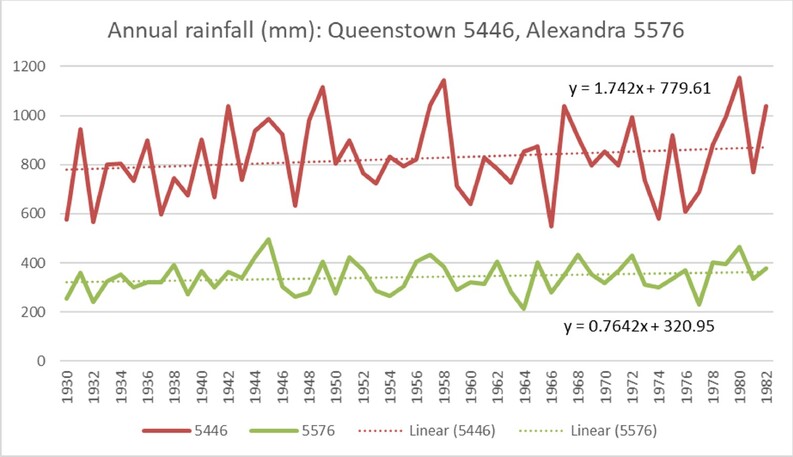
The second chart below compares Queenstown and Alexandra. Alexandra, further to the east, receives significantly less rain and the trend is a lower rate of increase in rainfall compared to Queenstown. With continued climate warming, the western grape growing sub-regions such as Gibbston and Wanaka can expect more significant rainfall increases than eastern sub-regions such as Alexandra.
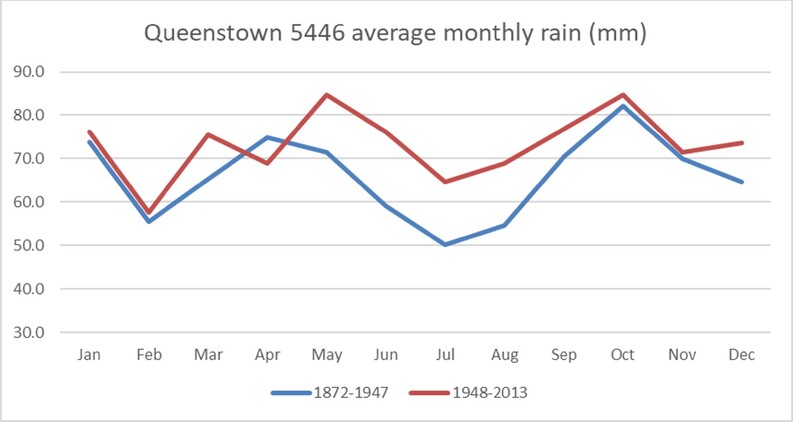
Queenstown 5446 has continuous rain data from 1872. When we look at the data month on month the increase in rainfall is not evenly spread across all months. The third chart below compares the first 75 years since 1872 and the last 75 years up to 2013. The Autumn-Winter months, May to August, receive most of the increase in rainfall.
Looking further afield at data published in proceedings of the XIV International GESCO Viticulture Congress, Geisenheim, Germany, 23-27 August, 2005, the trends are the same as we see in Central Otago. Focusing on pinot noir growing areas in France we see, Aloxe-Corton, Burgundy, over 45 years from 1959 to 2003, growing degree days increased by 165 GDD. By comparison, Central Otago GDD, over 90 years from 1930 to 2018 increased by 180 GDD (see Queenstown chart)
Mean temperatures in Reims, France, increased by 1.2 deg C over 45 years from 1970 to 2004. By comparison, Central Otago mean temperature increased by 1.5 deg C over 90 years from 1930 to 2017.
Phenological data was also published. (Phenology here refers to the study of the life cycle events of the grapevine during the growing season). This provides an indication of what would have been occurring in Central Otago even though grapevines have not been planted this long. This data is for pinot noir vines in Burgundy for the 50 year period 1950 to 2004. All phenological events are occurring earlier now than in 1950.
Budbreak: 11 days earlier
Flowering: 11 days earlier
Veraison: 10 days earlier
Harvest: 16 days earlier.
The conclusion from the proceedings paper (Changes in European wine grape phenology and relationships with climate.) is that “Over the last 50 years grapevine phenological timing in Europe has tended earlier with more significant changes in later events than earlier events.”
There is consensus among scientists these trends will continue globally. It is therefore clear in Central Otago, mean temperatures will continue to increase and the phenological events especially veraison and harvest will be earlier.
Some suggest weather events will be more extreme. The local historical data shown does not suggest things are becoming more extreme. There have previously been extreme vintages like 2017 and 2018.
At Grasshopper Rock we can respond to increasing temperatures with management and we take actions to minimise greenhouse gas emissions. These actions reflect our views on long term sustainability and where we can have the largest impact.
The California Sustainable Winegrower Alliance has summarised relative impacts for the carbon footprint of packaged wine, cradle-to-retail gate. They conclude the largest contributor to the carbon footprint is the glass bottle at 29% of the total carbon footprint. The next largest contributor is bio-geochemical field emissions at 17%. Bio-geochemical field emissions is the footprint associated with greenhouse case emission from biological cycles associated with applying nitrogen fertiliser, cultivation, composting and other management practices.
Glass bottles. We use Light Weight Traditional Burgundy bottles which weigh 417 grams. The standard Premium Burgundy bottles (545 g) are 31% heavier and are common in Central Otago. The Grand Burgundy bottles (702 g) which some use for their top end wines are 68% heavier than the light weight bottles. Not only can we reduce our carbon foot print significantly by reducing glass weight, we also reduce shipping volumes with the smaller cases size as a result.
In terms of managing for increasing temperatures, we are fortunate to be so far south that any increase in temperature can be managed with careful canopy management and harvest decisions.
In conclusion, we have evidence of a warming climate all about us. We can choose to ignore it or we can adjust how we think about the environment and how we manage grape growing. As a consumer we need to take our own actions. One simple action is to avoid heavy wine bottles, ask your favourite producers and retailers to offer light weight bottles and it’s time restaurant wine lists included bottle weights in the same way they now show vegan and organic logos.
References (click on links)
California Sustainable Winegrowing Alliance
Changes in European winegrape phenology and relationships with climate
Explaining New Zealand’s “unusual” growing glaciers
A note on weather stations
Very few weather stations in Central Otago have been continuously monitored for 50+ years. The priority in selecting the stations for this article was to have stations with 50+ years data. Changing stations mid-period would distort the data. Queenstown 5446 started in 1871 but the data is patchy and only continuous temperature data from 1930 to 2018. Alexandra 5576 has data for 54 years from 1929 to 1983 when it was closed. These two stations were selected because they both have data for a continuous 53 year period from 1930 to 1983. The trends for Queenstown 5446 from 1930 to 1983 and from 1930 to 2018 were consistent.
